 About this article …
In honor of the University of Illinois sesquicentennial, iSEE is doing a series of pieces on the rich history of ecological and environmental research and breakthroughs on campus. Our articles, photos, and videos also will touch on student, faculty, and staff activism and leadership on behalf of Mother Earth in the past 150 years — which have ramped up considerably in the past few decades! And this series will explore the future of sustainability, clean energy, and environmental efforts at Illinois and abroad.
Full list of iSEE articles >>>
Check out the U of I sesquicentennial website at 150.illinois.edu >>>
Illinois Alum Charles David Keeling (1928-2005): The Man Who Tied Human Actions to Climate Change

A Keeling Curve graph, annotated to highlight seasonal saw-tooth and notes on 1C 2C degree warming at what concentration of CO2. Image from of the Scripps Institute Oceanography.
Among the long list of notable University of Illinois at Urbana-Champaign graduates is a man who helped prove humankind’s impacts on climate change.
Charles David Keeling was the first scientist to develop an accurate technique for measuring in the air concentrations of carbon dioxide (CO2) — an important greenhouse gas that traps atmospheric heat. This landmark innovation of 20th century science has fundamentally changed our understanding of how and how much humans impact Earth’s climate.
The 2018 annual lecture in his name will be held April 25. Read more on 2018 speaker Eban Goodstein >>>
Read more about Earth Month and the five accompanying lectures >>
Born in Scranton, Pa., Keeling graduated from Illinois with a bachelor’s degree in Chemistry in 1948. He completed his doctorate in Chemistry at Northwestern University in 1954, and took a postdoctoral fellowship in Geochemistry at California Institute of Technology the following year.
While at Cal Tech, Keeling made Big Sur State Park his laboratory. He began collecting samples of air in flasks, and developed instruments and techniques to measure the amount of CO2 they contained. Keeling was able to establish a working background level for CO2: 310 parts per million.
Keeling’s efforts attracted attention, from scientists and the government. In the 1950s, most scientists did not think that burning fossil fuels to power cars or manufacturing equipment could have a measurable effect on the earth’s climate. They assumed most CO2 would be absorbed by plants or by the ocean.
With increased use of fossil fuels, however, some scientists began to consider the possible warming effects of CO2. One such scientist was Roger Revelle, director of the Scripps Institution of Oceanography in San Diego, who hired Keeling in 1956. Under Revelle’s guidance, and with federal funding, Keeling set out to measure CO2 levels around the world.

A view from above the National Oceanic and Atmospheric Administration Observatory in Mauna Loa, where Keeling began taking measurements in 1957. Photograph by Forrest Mims III, courtesy of the NOAA Mauna Loa Observatory.
The most important data came from a mountaintop weather station in Mauna Loa, Hawaii, where Keeling set up his equipment in 1957. For more than six decades Keeling’s two machines have taken daily measurements, under the careful scrutiny of Keeling and his technicians. Even after Keeling’s death in 2005, Mauna Loa remains a major atmospheric research station, and many others around the world have joined it in measuring the atmosphere.
The data gathered made possible two vital discoveries. First, Keeling determined that CO2 levels rise and fall during the day, as well as throughout the seasons, based on vegetation growth. Plants feed themselves through photosynthesis, and CO2 is a vital ingredient of that process. With more plants growing in the Northern hemisphere’s summer months, the CO2 levels drop for a time as the plants “breathe” it in.
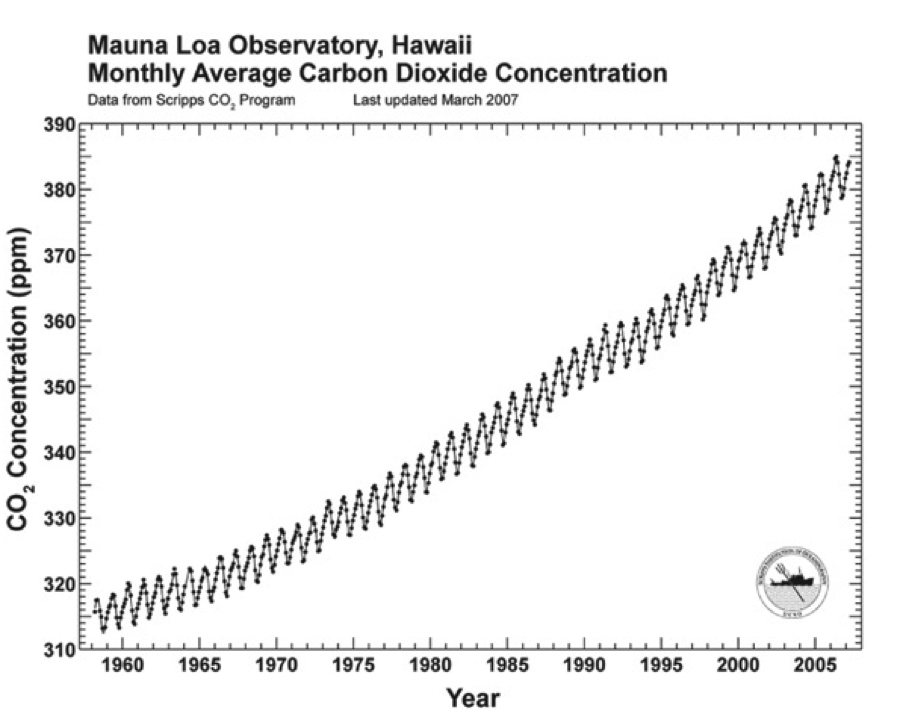
The famous Keeling Curve. Image from of the Scripps Institute Oceanography. (Click for larger view)
Second, he showed that atmospheric CO2 levels are rising each year. The first measurement recorded in Mauna Loa delivered an average concentration of 315 parts per million. Today, it has reached 403 parts per million. A graph of this rising number, which subsequent scientists point out is proportional to fossil fuel emissions, is now known as the Keeling Curve.
Today, Keeling’s Curve is inscribed on a wall at the National Academy of Sciences in Washington D.C., a testament to the profound effect his research has had on scientific understanding of the planet. His research has also been prominently featured in political discussions on climate change, like Al Gore’s book and movie, “An Inconvenient Truth.” Years-long debates on global warming have tried to challenge the science behind climate change, but very few debaters have taken issue with the validity of Keeling’s data.
Keeling was “a true pioneer,” according to Stanford Ecologist Christopher B. Field, who delivered the U of I’s 2016 Charles David Keeling Lecture on anthropogenic climate change. “He went out in the field and made measurements that nobody thought were going to work.
“And it didn’t take very long before the measurements he made with tremendous care and precision turned out to change the world.”
— Kate McQueen, iSEE Communications Graduate Intern